The Acoustic Data Management System is a relational database with automatic extraction of relative abundance based on user selection of species, locations or dates. This provides a rapid means to compare relative abundance of species by locations and or dates.
The ADMS uses the Acoustic Activity Index (See AI) and is standardized by 10 hours of survey time. Density maps can be generated from exported tables of relative abundance using X-Y coordinates of survey locations.
The ADMS imports the Header data file from the AnalookW program. On import the ADMS parses multiple species records in each call sequence file into separate species records. Concurrently the data are adjusted by survey time (unit effort) and standardized by 10 survey hours. Each geographic version includes all known species distributions by administrative unit providing users a quick way to extract relative abundance by selected area of a country as well as specific locations and or date ranges.
Currently the master ADMS New World bat database has > 1.8 million call records. This relational database includes updated distributions and taxonomy for all New World bat species. Call files recorded by Bruce Miller and collaborators are currently being uploaded to the Museum of Natural History’s (U.K.) BioAcoustica site to be freely available to all.
The Acoustic Activity Index (AI) was developed in the Neotropics where it is common to have up to five species in a 15-second recorded sequence. It is used to estimate the relative abundance of bats by measuring activity per minute, adjusting by the unit effort of survey time and standardizing by 10 hours.
This provides a bias-free method of comparing between locations and/or dates regardless of the number of individuals detected. This avoids the issue of a single bat circling around a detector and inflating abundance estimates. The AI is a repeatable and comparable measure avoiding the vague definitions of "Bat pass," for details see: Miller 2001.
Miller, B. W. 2001. A method for determining relative activity of free flying bats using a new activity index for acoustic monitoring. Acta Chiropterologica. 3: 93-105.AnalookW call file format is based on the legacy 8+3 file naming convention. The extension ending with the “#” sign designated a file as an Anabat/Analook call file. File names are encoded with the date and time of the original recording. The format follows a modified hexadecimal format for the year and month followed by the day and times as YMDDHHMM.SS#.
An updated format is now also in use. Such that a file example with both format names: L4221104.11# (legacy format) and L4221104_11.ZC (new format) are the same. The file name update does not change the internal format or behavior of the call file in AnalookW (Corben).
Kaleidoscope also records ZC files using this file format as well as conversion of WAV format to ZC.
AnalookW is the free software platform for viewing and analyzing zero-crossing format bat call files. The software displays call pulses and includes tools for parameter analysis and extraction and identification of bat echolocation calls. User defined filters provide for rapid scanning of entire data sets for subsequent review and vetting of identifications.
Many utilities are included in the AnalookW software that are useful for exporting call parameters and managing acoustic data. Global editing of header data (metadata) includes locations with X,Y and Z coordinates using the universal WGS84 datum and decimal degrees format. Exported header data (a text file) is imported into the ADMS to manage and track acoustic data.
See Corben for free download link.
Band width is the frequency range of a bat call.. Band width is measured in kHz and relates to the range of a call pulse from highest to the lowest recorded frequency. Bat calls are frequently characterized as having broadband or narrowband call sequences.
Broadband components normally consist of downward frequency-modulated (FM) elements of large bandwidth (steep modulation). An example of a broadband call would be a typical Vespertilionid with FM pulses ranging from a high to low frequency; e.g., Fmax (85 kHz) - Fmin (40 kHz) = a bandwidth of 45 kHz. Broadband calls include most species of Vespertilionidae when the maximum frequency may be in the 100-120 kHz range with and the minimum frequency being 40 or more kHz lower.
Narrowband components comprise two subtypes: quasi-constant frequency (QCF) elements with frequency changes of a few kHz between the onset and the end of the component (shallow modulation), and long constant frequency (CF) elements with frequency changes of only a few hundred Hz within the component. An example of a narrow band call would be a typical Molossid; e.g., Fmax (18 kHz) - Fmin (12 kHz) = a bandwidth of 6 kHz. Narrow band calls are seen in many species of Molossidae, Emballonuridae and the genus Pteronotus in the Mormoopidae. These may only have a range 8 kHz- 10 kHz from high to low frequency
Bandwidth is a relative parameter. See Fmax which greatly influences BW.
This is a vague term used in the early days of using acoustic data in ecology as an estimate of relative abundance. Often this was used as a simple count of the numbers of call pulses or sequences in a recorded file. Depending on the type of recording method e.g., full spectrum or zero crossing, the number of pulses recorded may vary widely and are not indicative of the number of bats or species passing by the microphone. This precludes using "bat pass" as a useful or unbiased comparison.
See AI: Acoustic Activity Index for a robust alternative
This site is an online repository and analysis platform for scientific recordings of wildlife sounds hosted by the Museum of Natural History (U.K.). Site address: http://bio.acousti.ca/
In order to freely provide vetted call files Bruce Miller and other collaborating authors such as Cynthia and George Marks, will soon be freely available. This addresses the lack of open and freely available acoustic data noted in published resources. See Baker, E., and S. Vincent. 2019. A deafening silence: a lack of data and reproducibility in published bioacoustics research? Biodiversity Data Journal. 7, for a critique of acoustic publications lacking data sources.
For a description of BioAcoustica see Baker, E et al. (2015) BioAcoustica: A free and open repository and analysis platform for bioacoustics. Database: bav054. doi: http://dx.doi.org/10.1093/database/bav054
The Body is that portion of the call with the lowest absolute slope or region where the call is "flattest" (i.e., closest to zero slope). It is said to start at the Knee, which is usually a point where a dramatic change of slope occurs (Corben). However, many calls are gently curved, with a continuous change in slope (Corben).
Note that for most bat calls, the slope of the call varies, as the frequency-time relationship is not linear.
The Body is likely to have some significance biologically, as the bat spends more time emitting frequencies in the band covered by the Body than elsewhere in the spectrum, and can therefore be expected to be most sensitive to those frequencies (Corben).
There is a close connection between the Body of the call and the characteristic frequency (Fc) or Peak Energy, commonly measured by those using spectral analysis of bat calls. Both reflect the slope of the call.
See Band width
A single echolocation sound is referred to as a pulse or a call, although these are frequently used interchangeably
A call sequence is made up of a continuous string of echolocation pulses. It is important to examine the entire call sequence when identifying species. Fragmented or isolated pulses may include call parameters that may overlap with other species and not be confidently assigned to a single species.
Such fragmented pulses that are out of the context of readily identifiable calls are frequently but not reliably assigned to a given species by the various auto-ID algorithms.
However, in the context of previous or following identifiable species sequences associated in time (e.g., a few seconds) with experience often call fragments may be confidently assigned to a given species.
Call shapes are important indicators for the identification of a species vocal signature. Even for unknown/unverified call sequences the call shape may allow inference to the family or genus of the species recorded.
Calls shapes generally have both family and genus traits. These include terms such as constant frequency (CF), frequency modulated (FM), Quasi-constant frequency (QCF) are used here as defined by Schnitzler and Kalko (1988), Korine and Kalko (2001) and Kalko and(1993)
H-U Schnitzler and E.K.V. Kalko, “How echolocating bats search for food," in Bats: Phylogeny, Morphology, Echolocation, and Conservation Biology, T.H. Kunz and P.A. Racey, Eds. Washington, DC: Smithsonian Institution Press, 1988, pp. 183-196.
Korine, C., and E. K. V. Kalko. 2001. Toward a Global Bat-Signal Database: A Standardized Protocol for Recording and Analysis of Bat Calls for Worldwide Species Identification. IEEE Engineering in Medicine and Biology. 81-85.
E.K.V. Kalko and H-U Schnitzler 1993. “Plasticity in echolocation signals of European pipistrelle bats in search flight: Implications for habitat use and prey detection,” Behav. Ecol. Sociobiol. vol. 33, pp. 415-428.
CF calls are those that are mostly at a constant frequency. CF pulses have a frequency change of only a few hundred Hz within the component. These are call pulses that remain at the same frequency for a period of time. Note that call pulses are not completely on the same frequency but generally have a short FM upsweep at the beginning of a pulse followed by a short FM downsweep.
For New World species these are emitted by species within the Pteronotus parnellii complex (Mormoopidae).
This section provides citations to published information relevant to a given species, and may relate to distributions, taxonomy or vocal signatures.
Clutter calls are those pulses emitted when a bat is flying in a background cluttered environment such as dense vegetation. Bats that are hand released, flown inside of an enclosure, entering or leaving roosts sites generally produce clutter calls. Clutter calls are often very similar between species of the same genus or family and are usually not diagnostic for confident acoustic identifications.
Clutter calls are frequently higher in Fc and have shorter TBC than free flying bats. When flown inside enclosures the amplitude is also usually considerably lower than free flying individuals as the bats avoid over loading their ears with sound.
See Hand release
Comet recordings are when one leg of a bat is tethered to a person or fixed spot and allowed to flying in a large circle while recording.
These are often the first attempt at verification of calls for a species.
Such calls may provide a rough starting point for vocal signatures. However, most HR calls are similar to high clutter and/or entering or leaving a roost.
This results in calls that are shifted higher in Fc with interpulse times that are shorter. Hence these calls are not often similar to a free flying search phase call sequence.
Commuting calls are generally of longer duration generic narrow band calls emitted when a bat is "commuting" or flying from point A to point B and not searching for prey. Commute calls are usually not diagnostic for a species identification and are used to avoid obstacles.
The conservation status is based on I.U.C.N. global assessments. For country level fact sheets county or regional criteria may apply that may differ from the global assessment.
When available country level references are included in the citation section.
Chris Corben is one of the pioneers in bat acoustics He is the author of AnalookW program and the early developer of the Anabat suite of acoustic bat detectors for Titley Scientific. Corben 2018. AnalookW, related programs and documentation can be freely downloaded at: http://users.lmi.net/corben/Beta/
Documentation includes call parameter discussion in the basic use of filters found on the link above.
See below for latest Anabat hardware:
https://www.titley-scientific.com/us/products/anabat-systems?SID=706971b0ac6d2527804d073dab19abec
The database species codes are unique identifiers used in the ADMS and other shorthand applications. These are comprised of the first 3 letters of the genus followed by the first 3 letters of the species as a 3+3 format. For U.S. bats typically a 2+2 system is used. However, the 2+2 format overlaps for many of the New World bat species, hence the 3+3 format. There are a few rare exceptions when a 3+4 format is necessary to avoid overlap.
Decibel (dB) – a way to express the ratio between two values. In acoustics, typically used as dB SPL to express the amplitude of a sound compared to the reference pressure amplitude of 20 microPascals. A logarithmic scale where a fixed difference always means the same ratio. As an example, 20 dB is a factor of 10, 6 dB is a factor of 2 etc.
Species base layer distribution polygons used included Patterson, et al. (2007), 2008 and 2017 IUCN global mammal distribution data and downloaded species specific spatial data sets (IUCN 2021). Distribution and updated polygons have also been created from publications relating to new species descriptions, taxonomic revisions or new distribution records.
Additional adjustments were also been made based upon recent papers relating to distributions and range extensions IUCN. 2019. https://www.iucnredlist.org/resources/spatial-data-download Patterson, B. D., Et al. 2007. Digital Distribution Maps of the Mammals of the Western Hemisphere, Version 3.0 NatureServe. 1-37.
The dominant harmonic (Hd) is the frequency of a call sequence that is usually detected. For the majority of New World bats the dominant harmonic is the H2 - second harmonic.
See Harmonic
The dominant slope of a given call pulse measured as the change in the kHz/ms.
See Total slope and Octaves per second for concerns about the usefulness of this measurement.
Some perceived variation or reported "plasticity" of calls may be explained by Doppler shift. Doppler shift is the change in the apparent frequency of a call sequence as a bat moves toward or away from the detector. This relates to the physics of sound waves and is not related to variation in what the bat is doing. This is always relative to the position of the detector microphone and when a bat is directly overhead there is no Doppler shift.
As an example, if a bat is flying towards the detector at 6.9 m/s, this represents a Doppler shift of 2%. If this bat is emitting a call at 40 kHz however it will be recorded as 40.8 kHz and a 100 ms. gap (TBC) between calls will be reduced to 98 ms. As this bat flies away from the detector, the Doppler shift will be in the reverse direction and the 40 kHz call will be recorded at 39.2 kHz and the TBC will increase to 102 ms.
From the above example the result would be a ± 4% difference in the frequencies recorded between as a bat flies toward the detector, passes then flies away.
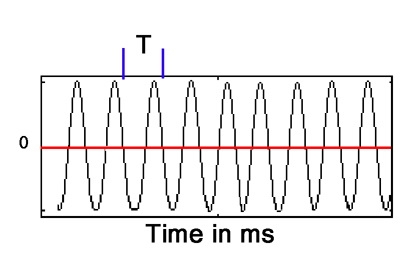
Duty cycle is the ratio of the duration of the call to the period of the call. This is usually expressed as a percentage. Duty cycle = (Dur/TBC) * 100, see Fenton (1999).
Fenton, M. B. 1999. Describing the echolocation calls and behaviour of bats. Acta Chiropterologica.1:127-136.
Fact Sheet Fusion (FSF) is the software platform licensed to Bruce Miller and used to develop the Fact Sheets for the vocal signatures of New World bats. FSF was developed by Identic Pty Ltd.
Fact Sheets are available in HTML, PDF or XML.
See Lucid.
The family is the higher taxonomic level provided for each species.
Vocal signature shapes frequently have familial relationships.
Fc is the Characteristic Frequency. "This is measured at the right-hand end of the portion of the call corresponding to the lowest absolute slope (the Body). Fc is the single most important parameter for species identification, as it shows a considerable robustness compared to other frequency measures, and has an inherent linkage to the actual shape features of the call" (Corben).
The Fc is generally at the dominant harmonic (Hd) as the H2
This is the first harmonic of the characteristic frequency (Fc) of a bat call. Often referred to as the Fundamental harmonic.
See Fc and Harmonic. Full spectrum software often displays simultaneous multiple harmonics.
A feeding buzz is also known as the terminal phase of a call sequence and generally, follows the approach phase. This is seen at the point where a bat approaches a potential prey item. The call pulses frequently shift to broader band pulses with extremely short interpulse durations (TBC). When recorded in real time, or played back in real time these pulses are so rapid that the audible sound is a buzz.
Such calls are not usually diagnostic for species identifications. Out of context feeding buzz pulses of many species which normally emit narrow bandwidth pulses may confound auto ID algorithms or those with limited experience. For example, many feeding buzz pulses of species of Molossidae shift to broadband pulses with short interpulse times and may be mistaken for broadband search phase calls of some Vespertilionids.
Feeding buzz data may be useful for ecological/conservation use to determine which habitats a species is actively foraging.
The final or end frequency is often reported for full spectrum measurements and is the last part of a call pulse.
Note that this is not synonymous with Fmin or the lowest frequency of a call pulse. Depending on the species this may include an upward inflection and be higher than the lowest frequency of a call pulse.
FM calls are frequency modulated pulses. These are pulses that have a rapid frequency change over time. These may be decreasing from a high frequency to lower frequency (Molossids and Vespertilionids) or increase from a low to higher frequency (Emballonurids and Molossids).
This is the highest frequency recorded in a call pulse.
There are a number of frequency parameters that can be measured. However; many are not especially useful for species identifications as they are dependent on conditions when recorded e.g., physics of sound transmission. This is especially true of Fmax. Frequently calls start at their highest frequency but at low amplitude then continuing increasing in amplitude as the frequency sweeps downward.
The point at which such a call is first detected is highly dependent on the distance from bat to detector, and other factors which will determine how much of the initial downsweep will be detected. This is a common reason why bat calls in a sequence appear to rise in Fmax towards the middle of the sequence, then fall again.
This is not a robust parameter to use in species identification (Corben).
Fragmented calls are those pulses that are incompletely recorded. This may be due to partial obstruction of sound between the bat and the detector microphone or more commonly the distance from the microphone.
For example, incomplete or fragmented calls may be recorded, if the bat is flying in dense clutter such as vegetation when only partial sounds are recorded through vegetation gaps. This is also encountered when bats are flying at the edge of the maximum distance range of sound detection. Out of the context of full call sequences, fragments are often not readily identifiable to a taxon (family, genus or species).
However, fragmented calls within several seconds of a preceding or following diagnostic recording and in the same frequency range may still be confidently assigned species identification. Note: auto-ID algorithms will frequently misidentify fragments as identifiable species.
Full spectrum recording includes amplitude data as well as frequency and pulse time information. In some publications this also referred to as time expansion
The fundamental frequency is also called the H1 or first harmonic; See Harmonic.
For New World species this is the most frequently recorded or displayed harmonic when calls are viewed in AnalookW.
This is generally the H2. Full spectrum software may display multiple harmonics simultaneously.
Florida Fish and Wildlife Conservation Commission, https://myfwc.com/
H1 is the first harmonic also called the fundamental frequency. See Harmonic.
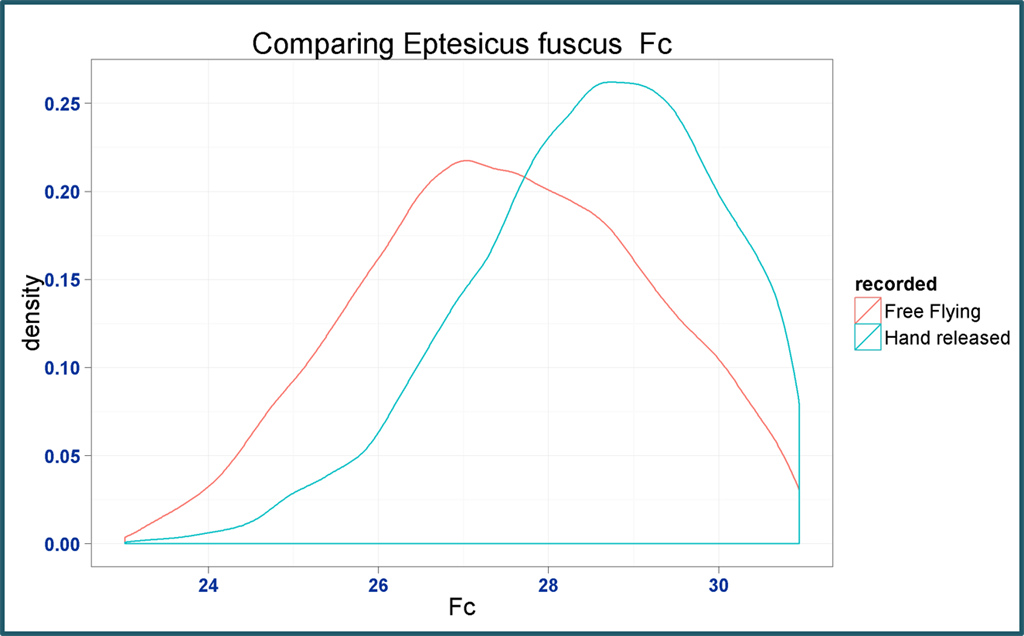
Hand released bat recordings are often the first attempt at verification of calls for a species. Such calls may provide a starting point for verifying vocal signatures.
However, most HR calls are similar to those recorded in high clutter and/or bats entering or leaving a roost. These calls are usually shifted higher in Fc with shorter interpulse times. In the graphic example of a density plot of Fc values. Eptesicus fuscus the red curve shows normal free flying values. The blue curve from a hand released bat shows the upward shift in the Fc values.
Consider the implications of auto ID algorithms trained from calls that may have been based on hand released bats!
A harmonic is a sound wave with a frequency that is a positive integer and exact multiple of the frequency of the original wave, known as the fundamental frequency.
The original wave may also be referred to as the 1st harmonic. As related to bat calls these are call pulses with a frequency that is an exact multiple of the frequency of the first harmonic (H1). As an example, a bat call with the H1 at 20 kHz would have the 2nd harmonic (H2) at 40 kHz and the 3rd (H3) at 60 kHz.
Depending on the species the loudest bat calls or those with "maximum energy" are usually recorded at the second harmonic H2. This is also referred to as the Dominant harmonic (Hd). Some full spectrum recorders may also record the H1 or H3 as having the most energy, i.e., the loudest pulses. This is dependent on the distance from the bat when the call is recorded.
The Hd is the dominant harmonic of a call where the majority of the Fc values will fall. For the majority of New World bats this is the H2.
See Harmonics and Fundamental harmonic for further discussion.
The initial frequency is often reported for full spectrum measurements and is the beginning of a call pulse.
In order not to interfere with each other, conspecifics will often shift the Fc of their calls up or down several kHz to avoid signal jamming so each will be listening to its own frequency returning echoes. For example, if one species is foraging in an area and using search calls at 50 kHz and another bat of the same species enters that same space it will shift up or down 2-3 kHz to avoid both jamming the other bat as well as be able to detect its own echoes. If a third individual enters the area there is a further shifting of frequencies in order to separate the individuals calls. In this example if bat A is calling at 50 kHz, bat B would be shift up and be calling at +/- 53 kHz and bat C would have shifted down to +/- 47 kHz.
Wildlife Acoustics acoustic full spectrum and zero-crossing call viewer. Kaleidoscope is a collection of tools for the efficient processing of acoustic and ultrasonic recordings. Some of these tools are licensed separately, such as the auto ID classifiers.
The auto-classifiers and cluster analysis are both useful as a rough cut to sort acoustic data for species identification.
The free version includes a WAV to ZC file converter that is useful for converting WAV files to ZC for use in AnalookW. The classifiers are useful for preliminary sorting of potential species they are not 100% reliable.
www.wildlifeacoustics.com/products/kaleidoscope-software-ultrasonic/download
kHz is the abbreviation for kiloHertz = 1000 Hz
Hz is one cycle per second; it is named for Heinrich Rudolf Hertz, who proved the existence of electromagnetic waves.
Known distribution information is useful to rule out species that are not probable in areas surveyed which may otherwise be misidentified.
For the New World set of Fact Sheets which include all non-phyllostomid species, the distributions are only at the country level. Country and U.S. state specific Fact Sheets include a finer detail of known distributions including administrative regions, counties and/or ecological zones of each country.
Distributions have been extracted from the I.U.C.N. Global Mammal database as GIS polygon shape files (link below) as well as current literature providing new distribution and taxonomic information. The distributions by country and administrative areas were then extracted in the GIS (ArcMap 10.8/ArcGis Pro) by Bruce Miller using spatial analytical tools.
Cynthia and George Mark are the founders of the Florida Bat Conservancy. The Marks were the pioneers in acoustic surveys throughout Florida. In addition to being the co-authors of these Fact Sheets and providing most of the call data, they published the Bats of Florida (Marks, C. S., and G. E. Marks. 2006. Bats of Florida. Pp. 1-176. University of Florida Press, Gainesville.)
They also conducted the first studies on the Florida Bonneted bat. Marks, G. E., and C. S. Marks. 2006. Status of the Florida Bonneted Bat (Eumops floridanus). Report to the U.S. Fish and Wildlife Service. Florida Bat Conservancy, Clearwater, Florida. 1-237.
Marks, G. E., and C. S. Marks. 2012. Status of the Florida Bonneted Bat (Eumops floridanus). Report to U.S. Fish and Wildlife Service. Florida Bat Conservancy 1-130.
Call pulses with the "maximum energy" are the loudest pulses recorded. Frequently calls with maximum energy are reported in publications and software relating to full spectrum recording. In many, but not all cases this frequency is analogous to the characteristic frequency or Fc. Also referred to as peak frequency. This usually is also the “loudest” part of a call measured
Bruce Miller is one of the early pioneers in developing noninvasive acoustic survey methods for identification of New World bat species for conservation and ecology. He has taught over 30 free acoustic workshops and recorded from the U.S. to Bolivia and Cuba. He developed the acoustic activity index (Miller, 2001). Given the high diversity of bat species in the Neotropics where it is common to record up to 5 species in a single 15 second call file and deploying up to 10 acoustic stations per survey for 8-10 nights with upwards of 1K files recorded per night per station per location he developed a plethora of tools for managing large data sets.
With 25 years of real time bat acoustic field experience and 55 years of working in conservation he is dedicated to providing free workshops and paying it forward by providing free vocal signature Fact Sheets and interactive identification keys for New World bat vocal signatures and working copies of the Acoustic Data Management System software.
This section includes any relevant notes for a given species. These may cover a range of related topics and are not necessarily vocal signature identification related.
Nuttall, Susie. An FWC biologist who has been working in the Florida Keys with extensive acoustic surveys and provided invaluable data for the species Molossus milleri.
Definition from physics relating to sound: An octave is a doubling (or halving) of a frequency.
Using Octaves per second (OPS) is a comparable way to measure the slope of a call pulse using the logarithmic form. This is used in the AnalookW software. It is based on the ratio of the start frequency to the final frequency of the body, divided by the time between them.
See Principle energy or Maximum energy
Peak frequency: See Principle energy or Maximum energy
Peak frequency: See Principle energy or Maximum energy
The Pmc is a derived or calculated parameter within the AnalookW program. The Pmc is defined as the Proportion of Maximum frequency to the Characteristic frequency.
As an example if Fmax is the same as Fc the Pmc would be 0, while if Fmax is twice Fc, Pmc would be 100. This parameter can be useful for separating calls where there is little overall decrease in frequency. The characteristic slope (Sc) is not as effective for this, because it says nothing about Fmax. Two calls could have the same Fc but the one with the lower Fmax would have the lower Pmc (Corben).
This is the dominant part of a bat call; also defined as the portion of a call pulse that has the "maximum energy" or loudest part.
See Maximum energy. Also referred to as the peak frequency
Quasi-Constant frequency pulse transitioning to a frequency modulated pulse.
Sc is the Characteristic Slope, or the slope of the Body of the call. It is a vitally important feature for call characterization, and a key means in which different species of similar Fc may differ. This is measured as octaves per second of frequency change;
See Octaves per second and Total slope.
The currently recognized binomial or scientific name is provided with the author to clearly identify species. This Bats of the World a Taxonomic Database and Geographic Database is used as the authority for current taxonomy.
Link and citation below https://batnames.org/ Simmons, N.B. and A.L. Cirranello. 2019. Bat Species of the World: A taxonomic and geographic database.
In recent years research has re-defined species names and relationships that are related to some vocal signature confusions of "plasticity" or call variations based on geographic distributions. In most cases confusing vocal signatures are becoming more defined as new taxonomic evidence is indicating that these are in fact distinct and unique species, not simply a "range of variation" in the vocal signatures of wide-ranging species.
Search-phase are calls emitted by a bat in flight when it is not actively chasing something (approach phase) or rapidly changing its context. Search-phase is characterized by regularity - a series of calls showing similar characteristics. This is an older term, which has traditionally been associated with calls given in low clutter. It is now understood that echolocation calls can change rapidly along a broad continuum ranging from commuting calls (zero clutter) to feeding buzzes (extreme clutter).
These are calls that historically were assumed to be "communication" calls now referred to as social calls. There is no clear idea of what the bats are "communicating." These are not diagnostic for species identifications
SonoBat is another commonly used full spectrum bat call software platform. It is a bat call analysis software offering tools for full spectrum recording and call analysis
See Szewczak and https://sonobat.com/
Sonospecies is a useful concept similar to morphospecies. These are unidentified species that are morphologically distinct from those currently known. Sonospecies are call sequences that appear to be individually unique species, but have yet to be matched with verified calls in order to assign a taxonomic name. These may include an associated Fc value e.g., 46 kHz Vespertilionid or 38 kHz Molossid where call pulses have recognizable familial or genus shapes but do not yet match verified vocal signatures.
The concept is useful and similar to unidentified herbarium or museum voucher records which may subsequently be identified or re-identified in the future and have a taxonomic name associated with the calls as additional species calls are verified.
These calls may also be referred to as phonic groups – groups of bat species share similar frequency ranges.
The source of the data used for call parameter extractions is provided. Sources may be publications or recorded data attributed to one or more individual bat researchers.
Miller's call data is being uploaded to available freely available to all. See BioAcoustica.
The database species codes are used as unique identifiers in the Acoustics Data Management System (ADMS). As of July 2019, the ADMS database had > 1.8 million call file records. In the U.S. species codes are standardized as 2+2 = 4 letters and based on the first 2 letters of the genus and species.
With a larger diversity of species throughout the New World the 2+2 letter codes result in many conflicting overlaps. Therefore a 3+3 = 6 letters are used as unique identifiers. In rare instances where 3+3 codes overlap these are extended to 3+4.
Joe Szewczak, Humboldt State University Bat Lab.
Author of SonoBat, Bat call analysis software offering tools for full spectrum recording and call analysis .See https://sonobat.com/ for details
The total slope of a given call pulse is measured as the change in the kHz/ms.; usually measured by full spectrum software however; this measure is dependent on the frequency of the call.
Most acoustic call software measures the slope of a call pulse as kHz/ms.
A disadvantage of using kHz/ms. is that the slope of a call at H2 will be twice that of the same call at H1; therefore, it is meaningless without knowing the frequency of the call measured (Corben).
See Octaves per second.
Vocal signature parameters have been extracted from acoustic call files and then summarized. Call files may be WAV files as full spectrum recording or zero-crossing files.
Each of the key call parameters that are useful for species identification include the valid number (N) of call pules measured, followed by the minimum, maximum, mean and standard deviation for each call parameter. This is followed by 4 bins with the percentages that each call parameter value falls within. These are 10%, 25%, 75% and 90%.
Parameters that are useful for species identification that are time values i.e. measured as milliseconds are the duration of each call pulse (Dur), time between calls or inter-pules interval (TBC).
Frequency related parameters measured in kHz include: the minimum frequency (Fmin) maximum frequency (Fmax) bandwidth (BW), mean frequency (Fmean) and the frequency at the knee (Fk). Three values for the characteristic frequency are provided that include harmonics. These are provided as many full spectrum software programs will display multiple harmonics. These are the fundamental (FcH1), Fc which is generally the dominant harmonic and the third harmonic FcH3.
The characteristic slope of call pulses is also provided and is measured in octaves per second (Sc). A derived value the Proportion of Maximum frequency to the Characteristic frequency (Pmc) is included and is often useful in separating species that have similar Fc values.
Call files of vetted species recorded by Bruce Miller and other collaborators are being made freely available to all. See BioAcoustica for details
See Zero crossing
Zero-crossings call data is the output of a zero-crossings detector, also called a Frequency Division bat detector. Each frequency value stored is the time taken for each cycle of the original signal to complete. The selected division ratio will impact the display on the screen in the software used. Currently a division ratio of 8 has been found to be best for recording, call display and measurement. This can be set in the AnalookW software so that legacy data recorded as division ratio 16 can be displayed as 8.
ZC format call data can be viewed in AnalookW, Anabat Insight, Kaleidoscope or Sonobat.
Zip line recordings are made with the bat tethered to a long line strung between points while recording the flying bat from one end to another.
Zip line use is often the first attempt at verification of calls for a species that is not ready to be released into the wild. Calls recording using a zip line may provide a starting point for verifying vocal signatures.
However, like most HR calls these are usually similar to high clutter and/or entering or leaving a roost calls. These calls are frequently shifted higher in Fc and have a shorter interpulse time than free flying search phase calls.
Such calls are not usually similar to a free flying search phase call sequence or diagnostic for species identifications.
See Hand release, Tethered or Comet.