Vespertilionidae
Guide for Acoustic Identification of Florida bats
Family
Database species code
Corraf or Cora
See glossary for explanation of codes
Scientific name
Corynorhinus rafinesquii (Lesson, 1827)
Taxonomy follows Simmons and Cirranello (2021)
Call shape
To view call graphics click on the camera icon on the right. You can then move through all images by using the left or right arrow keys. A left mouse click returns to the fact sheet.
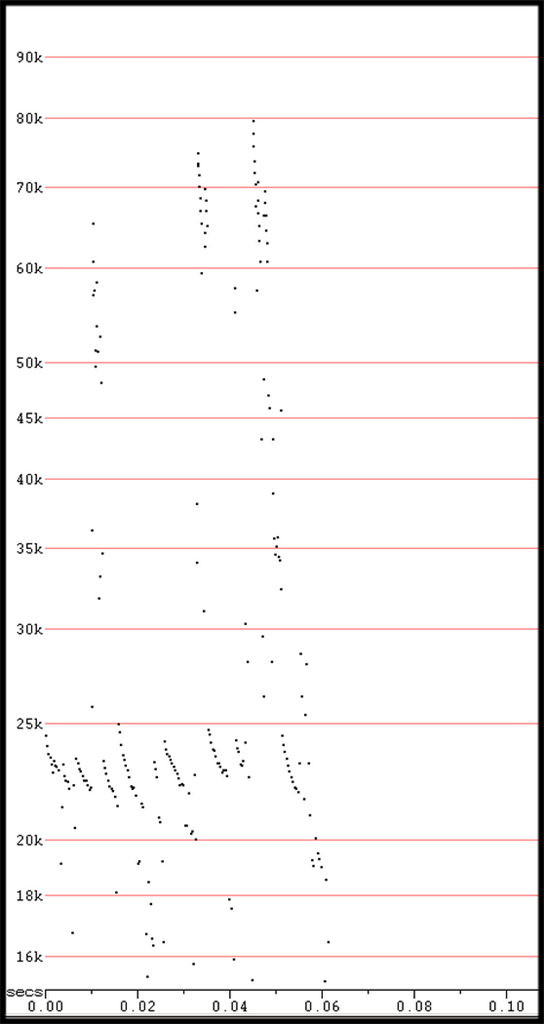
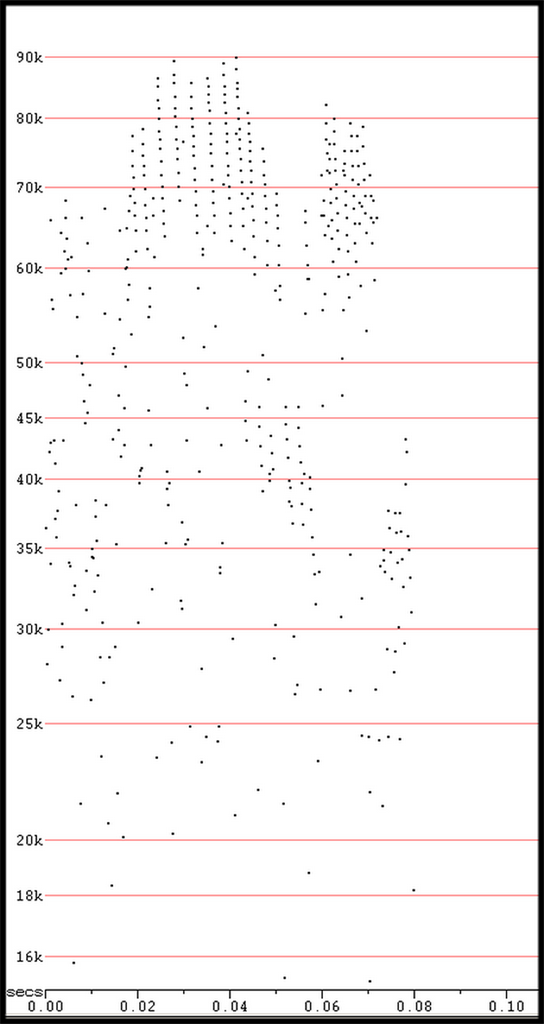
Broad band FM reversed "J" with pulses appearing nearly vertical. As a large eared vespertilionid this species vocalizations are fairly quiet, i.e., low intensity. See notes. Call images are from hand released bats therefore call pulses would not likely be typical of free flying search phase calls. Generally, vespertilionids emit “clutter” calls on hand release that are broader in bandwidth, higher in frequency and shorter TBC than free flying search phase calls. Two zero-crossing displays of the calls (AnalookW 4.5.w).
Vocal signature parameters
Call parameters are not robust/reliable at this time for definitive free flying identification. This large eared bat emits low intensity calls and may not be adequately recorded in the field as free flying bats. Parameters provided here have been extracted from files provided by Corben (top) and Finn (below) from hand released bats. These are primarily "clutter" calls and may not accurately reflect diagnostic free flying search phase calls.
From Corben data
| Parameters | N | Min | Max | Mean | St.Dev | 10% | 25% | 75% | 90% |
| Dur | 214 | 0.45 | 9.97 | 3.32 | 2.33 | 1.24 | 1.93 | 3.79 | 7.64 |
| Fmin | 214 | 20.2 | 54.4 | 28.4 | 4.8 | 22.6 | 24.6 | 32.2 | 34.4 |
| Fmax | 214 | 34.63 | 80.81 | 58.77 | 10.11 | 43.72 | 51.04 | 65.57 | 69.57 |
| BW | 214 | 5.26 | 53.85 | 30.33 | 10.36 | 14.33 | 24.56 | 36.45 | 42.29 |
| Fmean | 214 | 28.00 | 59.70 | 41.91 | 5.19 | 35.90 | 38.17 | 44.94 | 47.77 |
| Fk | 214 | 23.53 | 79.21 | 42.29 | 8.58 | 34.38 | 38.28 | 43.48 | 54.95 |
| FcH1 | 214 | 12.78 | 36.37 | 20.18 | 4.24 | 16.40 | 17.55 | 21.17 | 26.79 |
| Fc | 214 | 25.56 | 72.73 | 40.36 | 8.48 | 32.79 | 35.09 | 42.33 | 53.58 |
| FcH3 | 214 | 38.34 | 109.10 | 60.54 | 12.71 | 49.19 | 52.64 | 63.50 | 80.37 |
| Sc | 214 | -6850.2 | 3154.1 | 34.9 | 1088.3 | -66.0 | 37.2 | 288.9 | 517.5 |
| Pmc | 214 | 0.00 | 149.50 | 49.69 | 32.83 | 5.60 | 19.90 | 76.78 | 88.76 |
From Finn data
| Parameters | N | Min | Max | Mean | St.Dev | 10% | 25% | 75% | 90% |
| Dur | 22 | 0.28 | 5.34 | 1.56 | 1.40 | 0.57 | 0.63 | 1.95 | 3.80 |
| TBC | 16 | 71.03 | 7229.5 | 942.1 | 1838.6 | 82.51 | 101.8 | 876.4 | 2090.7 |
| Fmin | 22 | 20.2 | 28.78 | 23.55 | 2.55 | 21.40 | 21.70 | 25.66 | 27.4 |
| Fmax | 22 | 22.5 | 52.63 | 31.08 | 10.02 | 23.32 | 23.53 | 36.26 | 47.8 |
| BW | 22 | 0.43 | 31.15 | 7.53 | 9.10 | 1.06 | 1.58 | 9.59 | 21.3 |
| Fmean | 22 | 20.2 | 38.83 | 25.07 | 4.22 | 21.73 | 22.32 | 27.58 | 28.8 |
| Fk | 22 | 21.48 | 49.54 | 29.22 | 9.00 | 23.17 | 23.43 | 33.15 | 45.9 |
| FcH1 | 22 | 10.1 | 16.84 | 12.46 | 1.9175 | 10.9 | 11.06 | 14.09 | 15.2 |
| Fc | 22 | 20.2 | 33.68 | 24.92 | 3.83 | 21.71 | 22.12 | 28.19 | 30.5 |
| FcH3 | 22 | 30.3 | 50.52 | 37.37 | 5.7524 | 32.6 | 33.17 | 42.28 | 45.7 |
| Sc | 22 | -1367 | 2645 | 345 | 788 | 25 | 32 | 342 | 1381 |
| Pmc | 22 | 0 | 93.60 | 23.87 | 31.66 | 1.82 | 5.80 | 19.08 | 84.05 |
Parameters reported by Szewczak (2018).
| Corraf | Fc | Fmax | Fmin | FmaxE | dur | uppr slp | lwr slp | slp @ Fc | total slp |
| Mean | 22.8 | 39.8 | 22.5 | 33.2 | 2.6 | 6.2 | 7.4 | 6.7 | 6.7 |
| Max | 25.0 | 42.0 | 25.0 | 37.0 | 5.1 | 8.6 | 8.9 | 8.9 | 8.1 |
| Min | 20.0 | 37.0 | 20.0 | 30.0 | 0.1 | 3.7 | 5.9 | 4.4 | 5.2 |
Source of acoustic data
Laura Finn
Chris Corben
Known counties of distribution
|
|
Conservation status
Least concern; Ver.3.1 ; Population trend - increasing; evaluated 2008. (I.U.C.N. 2017.)
Notes
Britzke (2001) excluded calls of this species when evaluating the efficacy of acoustic detectors in a study of the ecology of bats in the eastern U.S due to the difficulty of detecting low intensity calls. In addition to low intensity calls that may be difficult to detect harmonics are often present. Call–shape simple linear FM sweep. Sometimes calls include an upsweep or flat tone at onset before sweeping downward (Szewczak, 2018).
The large frequency range reflects this species’ characteristic of sometimes applying more amplitude in the second harmonic than in the first. Lo F (and Fc) of the first harmonic typically ranges from ~19–27 kHz Szewczak (2018).
Citations
Britzke, E. R. 2003.Use of ultrasonic detectors for acoustic identification and study of bat ecology in the eastern United States Tennessee Technological University, Cookeville, TN.
Marks, C. S., and G. E. Marks. 2006. Bats of Florida. Pp. 176. University of Florida Press, Gainesville.
The IUCN 2017. Red List of Threatened Species. Version 2017-1.www.iucnredlist.org;. Downloaded on August 6, 2017.
Simmons, N. B., and A. L. Cirranello. 2020. Bat Species of the World: A taxonomic and geographic database. http://batnames.org
Szewczak, J. M. 2018. Echolocation Call Characteristics of Eastern U.S. Bats. Echolocation call characteristics of Eastern U.S. Bats. Unpublished report.
Guide for Acoustic Identification of Florida bats 2021, all rights reserved.